I inherited a React Native application that contains a web browser component. The Web browser injects window.ethereum as a web3 provider which means that there is some additional code that we need to write to the window element. Creating a Dapp Browser could be an entirely different post!
When testing this web component, I have a test application that outputs console logs when things happen; or in my case, didn’t happen! These logs are not accessible from the Android simulator or device. The console logs from the React code are accessible but that’s it.
Here is how to access the React Native WebView’s console logs:
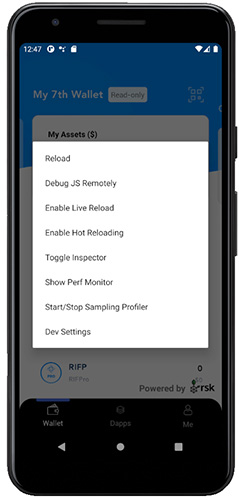
Start your android simulator or device and run the application. If you are on a physical device, shake it. On the emulator, click and press [Ctrl]+[M]. Click the second option, Debug JS Remotely.
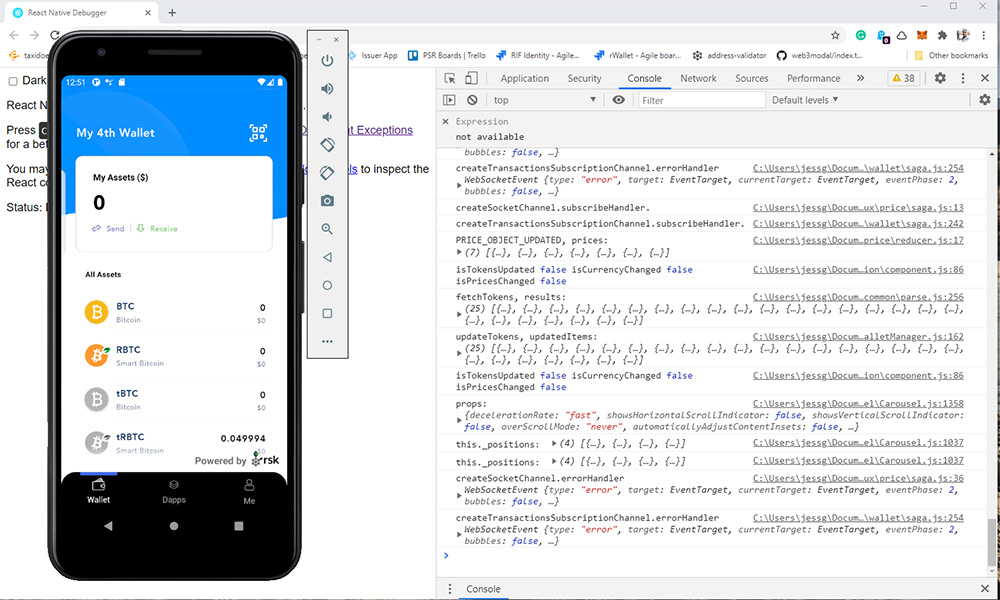
This will open up a web browser pointing to localhost:8081/debugger-ui. If Chrome is not your default browser, open the URL with Chrome. This may work with Chromium browsers but I’m not sure.
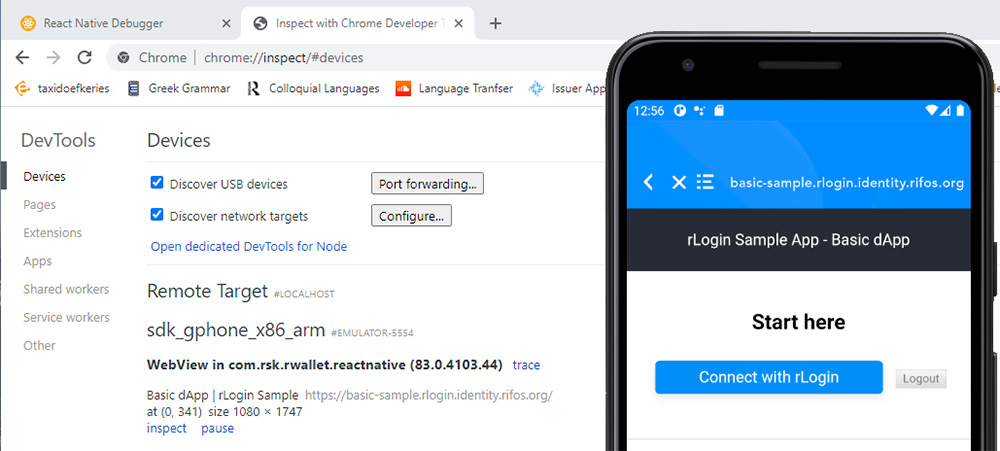
In Chrome, open a new tab and navigate to chrome://inspect/#devices. In the Simulator or Device, navigate to the screen with the WebView and navigate to a URL. Under devices WebView should appear, click on inspect.
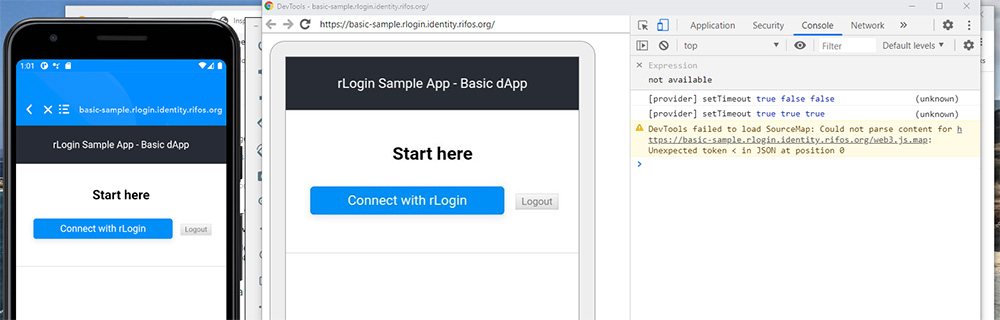
This will bring up a new window for the DevTools showing a preview of the WebView. You can’t interact with it, but you can interact with the simulator or emulator. This will bring up the console panel and from there you can see console logs from the WebView.
 The Meetings Are the Work
 Writing Code Was the Easy Part
The speedup is real. It's just smaller than the marketing.
Writing Code Was the Easy Part
The speedup is real. It's just smaller than the marketing.
 I Give Advice 75% of the Time. I'm Trying to Get to 50.